At Ortus we have been working hard to make BoxLang a reality!
One important part of plan is to make sure that we provide as best of a developer experience as we can. This means offering the tools that developers have come to expect from a modern programming environment - so we built an official BoxLang debugger! While we built our debugger with BoxLang in mind it has been part of our vision from the start that CFML would run seamlessly on the BoxLang runtime as well. That means you get the benefit of our debugger as long as you run your code on BoxLang!
What is a Debugger?
Have you used a debugger before? Have you used one on a regular basis? If you have great! Hopefully BoxLang’s debugger will make you feel at home. If you are unfamiliar with using a debugger as part of your development process let me introduce the concept to you.
Debuggers are a program that runs and controls the execution of the software you are developing. As the debugger is in control of the execution of each and every instruction it can freeze the program and provide the developer a chance to inspect the state of their software as if they could freeze time. Often debuggers will provide the developer power to inspect and change variables within their program and move execution back and forth.
As developers familiar with CFML we are all familiar with the writeDump() style of development. While outputting your applications state to the browser or a to a file has its place a debugger offers several benefits over a logging-based debugging approach. Here are just a few of them.
- Add/remove breakpoints as your programming executes instead of having to rerun the request
- Inspect variables at each iteration of a loop
- Modify the value of a variable and continue execution
- Step through each method of a call stack to see the different levels of an application
If you have never used a debugger before it can be daunting to get started. We have put a lot of effort into making the BoxLang debugger as easy to get started as possible.Let’s take a look at how to use it.
Debugging a BoxLang Script
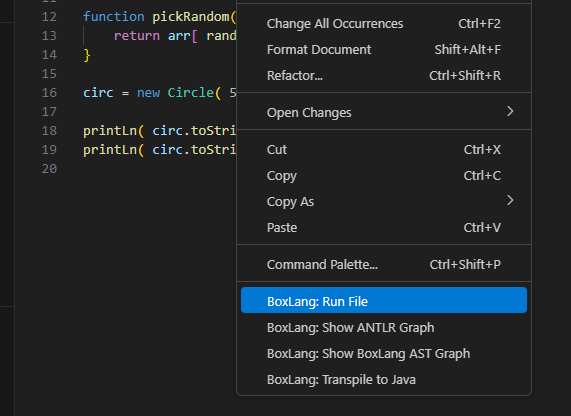
Let's say you have a .bxs file. This is BoxLang’s CLI script extension. With a .bxs you can execute your file on the command line just like any other scripting language. Our VS Code extension makes it even easier. We provide a right-click option to run BoxLang files.

Once you click the BoxLang: Run Script option. Your program will execute. The debug console will auto-focus and you will see the console output of your program. “Great!” You might say, “But what about debugging! That is the whole reason I’m reading this wordy post!” Fair enough! Let’s look at that next.
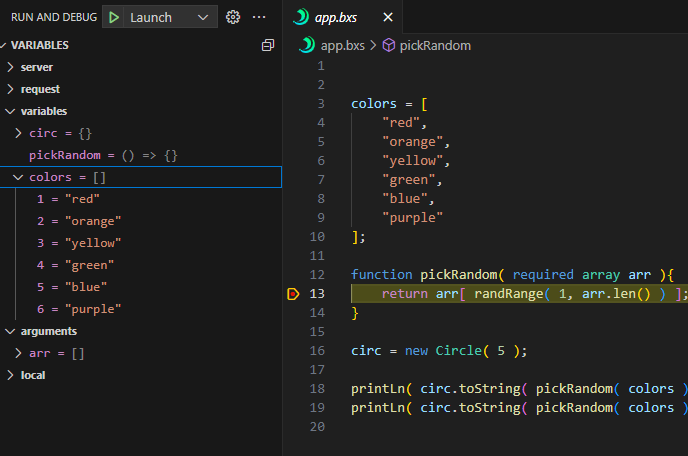
If you want to debug a script you will need to set a breakpoint. To set a breakpoint simply hover your cursor over the gutter to the left of the file’s line numbers. When you see a red dot appear, “click” and you will set a breakpoint at that line. Now that you have a breakpoint go and ahead and use our right-click BoxLang: Run Script option to kick off a debug session. This time your script will pause at your breakpoint.
Debug Controls
Now that we are debugging, what special actions can we take? We’ll briefly look at 3 features of our debugger: variables, the call stack, and debugger controls.
The Variables Panel gives you information about the state of your program. You can view and even edit variables by looking at the data presented by this panel. This is where much of the value of the debugger comes from. At every breakpoint you hit you will see an up-to-date snapshot of your application state.

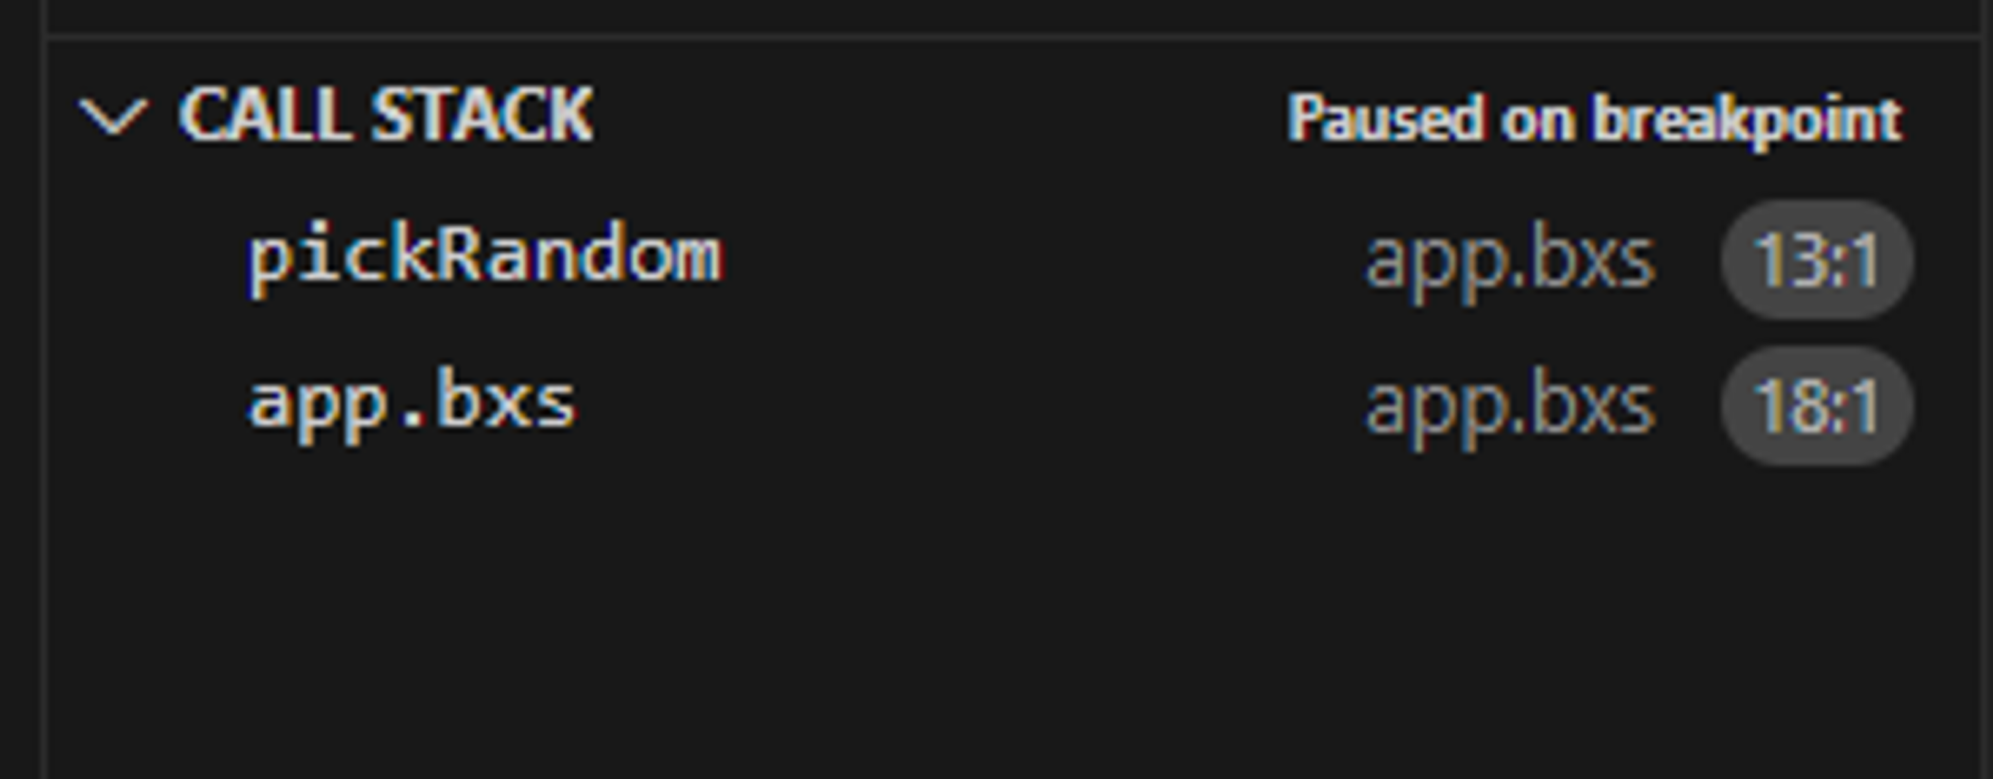
The Call Stack Panel lets you see the entire call stack of your current location in the code. This feature is a little more advanced than the variables panel but can provide vital information that helps you understand the flow of code in your app.

Finally, we get to the debugger controls. These controls are the unsung hero of every debug session, you’ll use them often as you incorporate the debugger into your workflow.

- Play/Pause - Resume execution if paused/pause execution of a running program
- Step Over - Move to the next pausable location without moving down the call stack
- Step In - Move into a deeper stackframe if able or Step Over
- Step Out - Move to the parent stackframe
- Stop - Stop debugging
The controls mostly speak for themselves. The best way to get familiar with them is simply to jump in and play around.After just a few minutes playing around with them it will become second nature to use them as part of your debug process.
Conclusion
I hope you will agree that the BoxLang Debugger is a powerful addition to the set of tools we at Ortus have built to help you develop BoxLang applications.** But wait, there's more!** Did you know that we’ve also built tools to help you instantly spin up a mini web server right in your editor? Did you know that the mini server and debugger integrate with each other right out of the box? We will cover those features in an upcoming blog post.


Add Your Comment