Logging and Debugging with ColdBox
Brief intro
Every developer has ever felt or asked themselves one of the following questions more than once in their life:
- Are you exhausted from using
writeDump()each time you have problems? - Do you spend more time-solving issues than creating new features?
- Is a legacy block code giving you a headache?
- Have you ever had nightmares and dreams in which you fix everything but forget it once you wake up?
- Still, troubleshooting your ColdBox apps the old-fashion way?
- Are you reading this like a television advertisement?
If your answers were yes to almost all of those questions, let me tell you about our powerful tools called cbDebugger & LogBox (To be sold separately, just kidding, they are open-source and free), which are going to help us with tons of features:
- Track all incoming HTTP requests, final request collections, parameters, body in your applications by doing it in memory or offloaded cache.
- Track exceptions and execution environment
- Track Hibernate and CBORM queries, criteria queries, and session stats.
- Track QB and Quick queries, entities, and stats.
- Tap into LogBox via our Tracer messages and discover logging on a per-request basis.
- Profile execution and results of ANY model object and ANY ColdBox interception point
- Custom Timer helpers for adding timing methods and annotations anywhere in your code
- Profile your production or development apps with ease.
- Track ColdBox modules and lifecycles.
- Highly configurable and extensible
- Track Adobe ColdFusion Queries (ColdFusion 2018+)
- Allows you to quickly build upon its logging framework to meet any logging or reporting needs your application has
- Categorizes your logging and/or tracing statements according to user-defined categories that can be configured at runtime or pre-runtime
- Categorizations can have their own logging level ranges (such as debug or info)
- Allows you to create multiple destinations for your loggings or change them at runtime
- Offers you the capabilities to filter out or cancel logging noise a-la-carte
Debugging
NOT a boring practice with ColdBox

Installation
Super easy to install and start using with our terminal powered by CommandBox.
box install cbdebugger --saveDev
Note: --saveDev flag is important since we want to debug in development environment only.
Once the module is installed will be automatically activated to be used with the default settings. You will notice in your footer section a new collapsable panel when running in development mode.

There is a useful visualizer that will help us with you history just by adding /cbDebugger to the root of our hostname in the URL
Settings
Inside of your project with cbDebugger installed, locate config/Coldbox.cfc and search for the moduleSettings struct, add the key cbDebugger with the options you require:
moduleSettings = {

	// Debugger Settings
	cbDebugger = {

		// Master switch to enable/disable request tracking into storage facilities.
		enabled : true,

		// Turn UI on/off. You can enable it via URL with debug password. Debugger will still collect request tracking
		debugMode : true,

		// The URL password to use to activate it on demand
		debugPassword : "cb:null",

		// Shows or not the debugger panel docked at the bottom of the page. If disabled the only way to visualize the debugger is via the `/cbdebugger` endpoint
		requestPanelDock : true,

		// Request Tracker Options
		requestTracker : {
			...
		},

		// ColdBox Tracer Appender Messages
		tracers     : { enabled : true, expanded : false },

		// Request Collections Reporting
		collections : { enabled : false, expanded : false },

		// CacheBox Reporting
		cachebox    : { enabled : false, expanded : false },

		// Modules Reporting
		modules     : { enabled : false, expanded : false },

		// Quick and QB Reporting
		qb          : { enabled : true, expanded : false },

		// CBORM Reporting
		cborm       : { enabled : false, expanded : false },

  		// Adobe ColdFusion SQL Collector
 		acfSql      : { enabled : true, expanded : false }
	}
}
There are much more options you can setup. Please feel free to visit this module in our package manager ForgeBox to learn more.
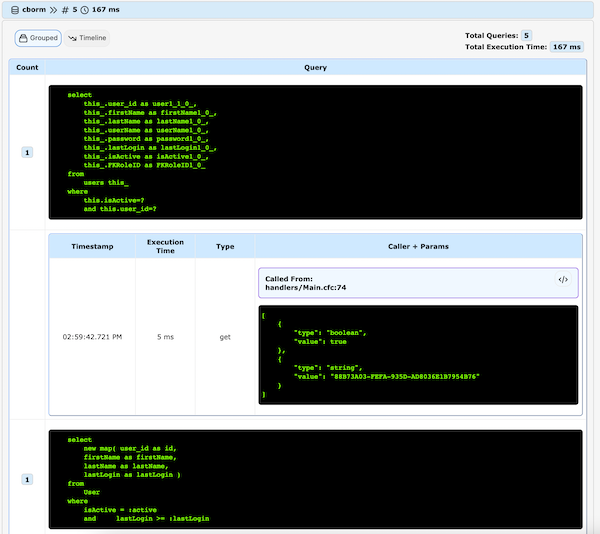
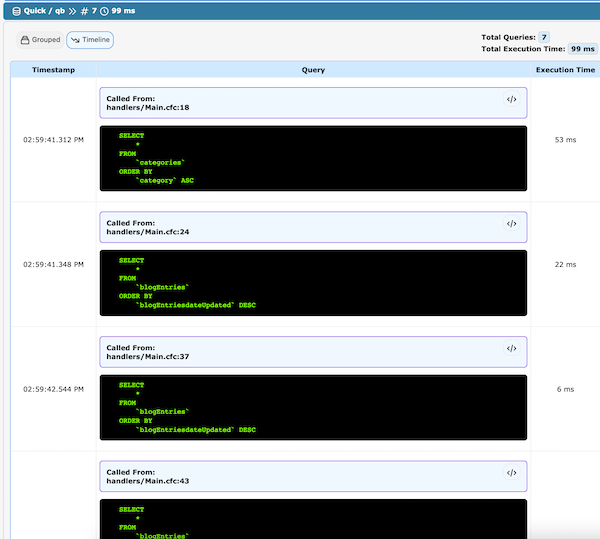
Databases
One of the most powerful thing is the ability of get a tracker of your database queries even with a traditional queryExecute() or ORMExecuteQuery() for Hibernate including objects more complex as CBORM or Quick/QB entities (Must be previously configured)
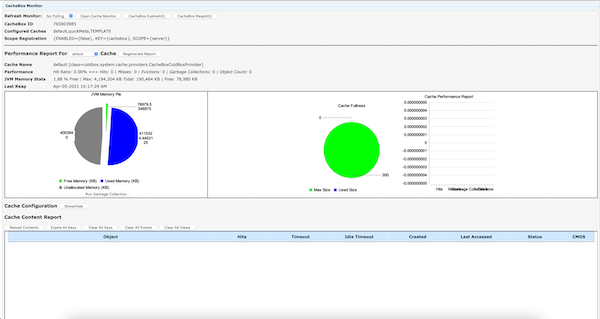
Cache
You can also enable the CacheBox monitor and get complete insight into all your registered application caches.
Logging
Logging is essential when you are trying to replicate an error, need to know what happened to a server which is remote or with limit access. It gives you a history list of messages with dates and times those messages could be informative, warnings, errors or simple default “logs”. For more information go to our GitHub repository and start contributing in our projects.

A !Boring Practice
Installation
Just copy and paste the following block of code in your terminal placed on your project root folder. This will be possible thanks to CommandBox:
box install logbox
Or you can download an standalone version if you are using CFML without any framework (Please consider to change to our Incredibly Awesome ColdBox Platform Framework)
Configuration
As most of the modules you can setup everything via config/Coldbox.cfc and search for the moduleSettings struct, add the key logBox with the options you require:
//LogBox DSL
logBox = {

	// Configuration file without file extension to use for operation, instead of using this structure
	configFile = "config/LogBox",

	// Appenders
	appenders = {
		appenderName = {
			class = "class.to.appender",
			layout = "class.to.layout",
			levelMin = 0,
			levelMax = 4,
			properties = {
				name  = value,
				prop2 = value 2
			}
		}
	},

	// Root Logger
	root = { levelMin = "FATAL", levelMax = "DEBUG", appenders = "*" },

	// Granualr Categories
	categories = {
		"coldbox.system" = { levelMin = "FATAL", levelMax = "INFO", appenders = "*" },
		"model.security" = { levelMax = "DEBUG", appenders = "console" }
	}

	// Implicit categories
	debug  = [ "coldbox.system.interceptors" ],
	info   = [ "model.class", "model2.class2" ],
	warn   = [ "model.class", "model2.class2" ],
	error  = [ "model.class", "model2.class2" ],
	fatal  = [ "model.class", "model2.class2" ],
	off    = [ "model.class", "model2.class2" ]
};
Using it
The following is a list of methods that you could use, the two most important are getRootLogger() & getLogger(), which you will use to get the root or named logger objects.
| Method | Description |
|---|---|
LogBoxConfig getConfig() | Get the config object registered |
Logger getLogger( any category ) | Get a named logger object using a category string or the object you will log from |
Logger getRootLogger() | Get a reference to the root logger |
string getVersion() | Get the current version of LogBox |
string getCurrentAppenders() | Get a list of currently registered appenders |
string getCurrentLoggers() | Get a list of currently instantiated loggers |
void configure( LogBoxConfig config ) | Dynamically re-configure the LogBox library |
We recommend using the available can{severity}() methods to determine if we can log at a specific log level before actually writing the logging method line. This is done as best practice in order to avoid processing of messages that will never be logged anyways
if( log.canDebug() ){
	log.debug( "This is my log message, some #dynamic# date is here", dataCFC );
}
Summary
Remember:
Time is what we want most, but what we use worst.
— William Penn
We would like to suggest that you prioritize making your life easier by spending less time fixing bugs and more time creating beautiful code. Take the time to debug and improve what you can, while keeping track of your progress. To truly be a professional, make use of our tools and feel free to discuss them with others. We invite you to check out our previous ColdBox 7 roadshow blog posts for even more amazing features and to leave your comments and feedback.:
Add Your Comment